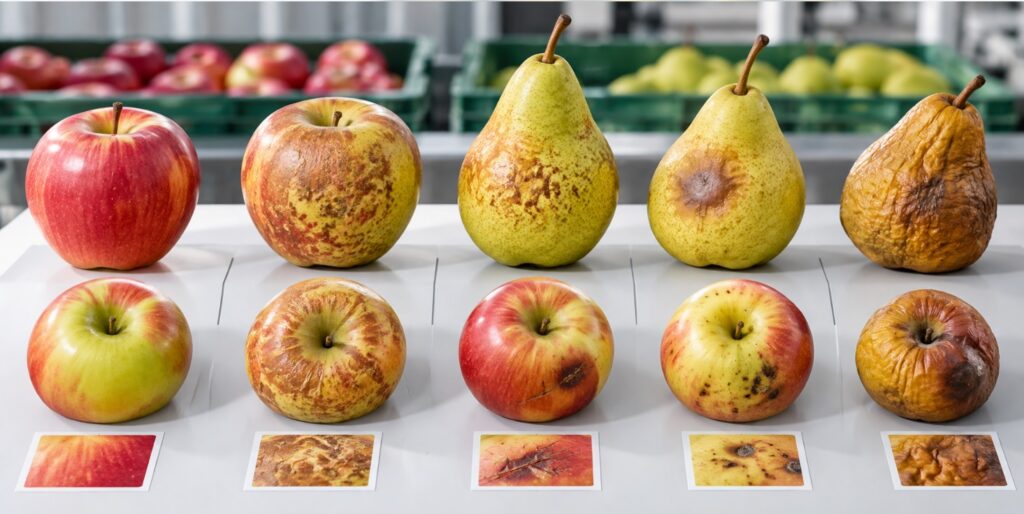
How to Build a Supplier Scorecard from Fresh Produce QC Data
- Quality Control App
Supplier conversations tend to repeat from season to season:
- Quality was inconsistent.
- Rejections were too high.
- One site had more problems than another.
Everything in that list may be true, but it’s also vague, which is why these conversations tend to recur, and tend not to improve things. Without comparable numbers, a bad week and a persistent supplier problem are hard to tell apart.
Most fresh produce businesses already collect the data needed to change that conversation through routine quality inspections. A fresh produce supplier scorecard turns those inspection results into a consistent way to measure supplier performance over time.
This guide explains how to turn scorecards into a practical tool for supplier decisions.
Definitions first: What is a fresh produce supplier scorecard?
The scorecard is a structured, recurring evaluation of each supplier against a fixed set of quality metrics that come from inspection data. Buyers and quality teams can use a scorecard like this to:
- Compare performance over time: Supplier A’s spec pass rate moves from 88% in Q1 to 95% in Q3.
- Identify trends: Bruising in Supplier B’s stone fruit rises across three consecutive deliveries, pointing to a developing handling issue.
- Assess suppliers against the same standard: Two grape suppliers are scored against the same size, color, firmness and defect tolerances, making the comparison meaningful.
Is this a supplier audit by another name?
Supplier audits tend to be one-off, capturing performance at a specific point in time. Audits and complaints logs identify problems only after something has gone wrong.
This is inevitable when judgments about supplier quality are informal: teams know which suppliers are considered reliable and which ones tend to create problems. But those judgments are difficult to compare across sites, seasons, or categories.
A supplier scorecard gives that quality assessment a consistent numerical basis. Instead of relying on memory or isolated incidents, buyers can see how often a supplier meets spec (or doesn’t,), and whether performance is getting better or worse.
5-7 metrics that belong on a produce supplier scorecard
By using these metrics, teams can measure supplier quality performance with data the QC they are already collecting.
| Metric | How it’s calculated | What it tells you |
| Spec pass rate | % of inspected lots meeting the buyer’s specification on first inspection | Overall reliability against your standard |
| Defect rate, by class | % of sampled units with major or minor defects, broken down by defect type | Where quality is failing, such as bruising, decay or sizing |
| Rejection or downgrade rate | % of deliveries rejected or downgraded at intake | Direct exposure to claims, rework and lost value |
| Grade distribution | Share of lots falling into each grade band over the period | Whether quality is consistently strong or highly variable |
| Arrival internal quality | Average Brix, firmness or dry matter against the specification, where measured | Eating quality and potential shelf-life performance |
| Variance between sites or inspectors | Spread of results for the same supplier across receiving locations | Whether inconsistent results may reflect the supplier or the inspection process |
| Trend vs. prior period | Change in key metrics such as pass rate or rejection rate versus the prior season or quarter | Whether supplier performance is improving, stable or deteriorating |
Weighting and scoring with a worked example
Assign each metric a weight based on its commercial importance for the category, and convert each result to a 0-100 score. Then you can calculate a weighted total for each supplier over a defined period.
The weighting is up to you. It should reflect what carries commercial consequences. For example, a retailer may give more weight to spec pass rate and rejection rate than to season-over-season improvement. Those measures have a more immediate impact on intake decisions and claims.
Here is a simple illustrative example:
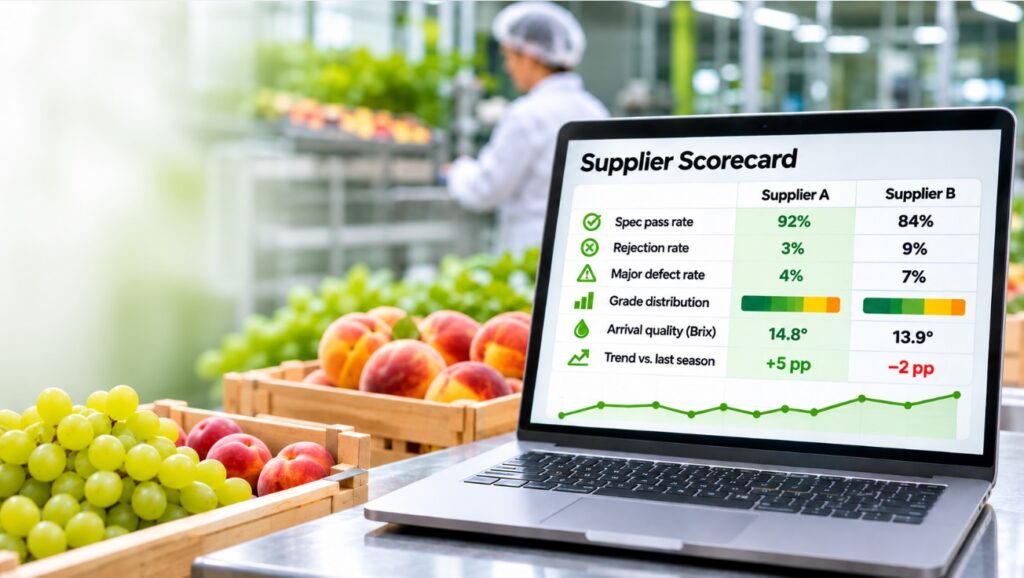
| Metric | Weight | Supplier A | Supplier B |
| Spec pass rate | 40% | 92% → 92 pts × 0.4 = 36.8 | 84% → 84 pts × 0.4 = 33.6 |
| Rejection rate, inverted | 30% | 3% → 97 pts × 0.3 = 29.1 | 9% → 91 pts × 0.3 = 27.3 |
| Major defect rate, inverted | 20% | 4% → 96 pts × 0.2 = 19.2 | 7% → 93 pts × 0.2 = 18.6 |
| Trend vs. last season | 10% | Improving → 80 × 0.1 = 8.0 | Flat → 50 × 0.1 = 5.0 |
| Weighted score | 100% | 93.1 | 84.5 |
For negative metrics such as rejection rate or major defect rate, invert the score so that lower rates produce higher scores. A 3% rejection rate, for example, becomes a score of 97.
Ordinary data handling practices apply, of course. Use enough inspection data that one unusually bad delivery does not distort an entire season’s score. It’s also important to compare like with like. A citrus supplier and a grape supplier should not get the same raw thresholds, and performance from different seasons may need normalization.
Now, the data: what you need, and how to collect it consistently
Quality inspection data is non-negotiable. Supplier scorecards deliver the best results when specifications, defect definitions and sampling approaches stay consistent at every receiving point.
If one DC records “bruising” as a major defect while another logs the same condition as minor, supplier-level comparisons quickly become unreliable. The same problem appears when inspectors use different sample sizes or interpret tolerances differently. Put simply, you are no longer comparing apples with apples.
Here are three things to standardize right away:
- A written quality specification that defines the thresholds suppliers need to meet.
- Shared defect definitions so you can classify the same condition the same way across sites and inspectors.
- A consistent sampling method so one supplier is not being judged on 20 units at one location and 100 at another.
The more sites and inspectors you have, the harder this becomes to manage through paper forms or disconnected spreadsheets. But with structured records, you can aggregate the same inspection data by supplier, commodity, site, and season without rebuilding the analysis each time.
Use the scorecard to drive supplier decisions
Your scorecard is a recurring decision tool that you review quarterly or at the end of a season. Start by sharing it with the supplier before the meeting so both sides are working from the same numbers. Then connect the results to specific actions such as allocation, pricing, improvement plans, or whether the relationship should continue.
The biggest value supplier scorecards bring is that they change the conversation from “he said she said” to “the data says”.
For example:
- After a bad week: instead of debating whether quality has “really slipped,” review the supplier’s pass rate and defect trend across the full period.
- During a new-supplier trial: compare early inspection results against established suppliers using the same quality metrics.
- In a claim dispute: use the underlying inspection data to show what inspectors recorded at intake, and how often the issue occurred. On that basis, you can decide whether it was once-off or part of a wider pattern.
The scorecard should also show direction, not just a final score. A supplier moving from 78 to 86 over a season may warrant a different conversation from one moving from 92 to 86, even if both finish on the same number.
Five ways supplier scorecards become unreliable (all of them are easy to stumble into)
Most problems come from weak inputs or from giving too much weight to single events.
- Scoring complaints instead of inspections: Complaints only capture visible issues. Routine inspection data gives a fuller picture of performance.
- Mixing commodities in the same comparison: Always compare suppliers within the same commodity and, where relevant, the same variety or program.
- Using inconsistent defect definitions: If one DC records bruising as major and another records it as minor, the scorecard is measuring inspection inconsistency as much as supplier quality.
- Letting one bad load dominate the season: View rejections in the context of the supplier’s broader history. Otherwise, one event can distort the overall picture.
- Building the scorecard once and leaving it static: Update it as new inspections come in so everyone can see whether quality is moving in either direction.
Build the scorecard from the QC data you already collect
This might all sound like a separate reporting project. But a supplier scorecard can actually be an output of the QC process.
Once inspectors capture data digitally against standard specs, the underlying data can feed comparisons of suppliers, sites, commodities, and seasons. That makes pass rates, defect patterns, rejection trends, and quality shifts much easier to surface consistently.
Clarifresh applies this model to fresh produce QC, structuring inspection data so teams can analyze supplier performance over time and use it in sourcing and review decisions. Computer vision can further support consistency by helping inspectors classify defects against the same criteria.
Book a walk-through to see how Clarifresh can help turn inspection data into a stronger basis for supplier decisions.
Frequently asked questions
What is a supplier scorecard in fresh produce?
A supplier scorecard is a recurring evaluation of each grower or supplier against a fixed set of quality metrics – such as spec pass rate, defect rate and rejection rate – calculated from intake inspection data. It replaces impressions with comparable numbers that can be tracked across seasons and used in supplier reviews.
Which metrics should a produce supplier scorecard include?
At minimum: spec pass rate, rejection or downgrade rate, major defect rate by class, grade distribution, and trend versus the prior period. Where internal quality is measured, add arrival Brix or firmness against the spec minimum. Commercial metrics like price and delivery can sit alongside but should not replace the quality column.
How often should you update a supplier scorecard?
Scores should refresh continuously as inspections are logged, but formal reviews are typically held per season or per quarter. Reviewing too often amplifies single bad deliveries; reviewing too rarely means problems are discovered after the season is over.
Can you build a supplier scorecard without QC software?
Yes, if inspection results are recorded consistently and can be aggregated – usually in a spreadsheet. The difficulty is consistency: paper or ad-hoc spreadsheet records from multiple sites rarely use the same defect definitions or sampling, which makes supplier comparisons unreliable at scale.
How do you use a supplier scorecard with growers?
Share the scorecard before the review so the conversation is about the numbers, not about whose memory is right. Tie scores to clear outcomes – allocation, pricing tiers, improvement plans – and show the trend so good suppliers see their consistency recognised.