Retailers are measuring the wrong things in fresh produce
- Quality Control App

There’s a certain comfort in “easy metrics”. Retailers rely on these indicators to bring structure to a category that is inherently variable.
Fresh produce is shaped by factors that are difficult to control: weather, seasonality, biological variability, and time. Against that backdrop, KPIs provide a sense of order. They allow procurement teams to compare suppliers, enforce expectations, and operate at scale.
The metrics that have emerged as standard reflect this need for clarity:
- Fill rate
- On-time delivery
- Order completeness
They are practical and consistent. And they translate well into dashboards and scorecards. But in fresh produce, what is easiest to measure is not always what matters most.
The primary objective for retailers in this category is not simply to move product efficiently through the supply chain. It is to present consistently high-quality produce at the shelf, day after day, across locations.
That consistency is what shapes customer perception. And over time, it is what builds or erodes loyalty.
The metrics retailers love
The dominance of logistics metrics in produce procurement is inevitable to some degree.
They offer a level of precision and comparability that is difficult to achieve elsewhere. A supplier either meets a 97% fill rate or does not. A delivery is either on time or it is not. These are clean signals in an otherwise noisy system.
From an operational standpoint, they are highly effective at creating accountability and enabling benchmarking. It should also be said that they do support decision-making at scale.
But they measure one specific dimension of performance: execution against an order. How that order performs once it enters the store environment is an entirely different matter.
A shipment can be delivered in full, on time, and in perfect condition from a logistics perspective, and still fail to deliver a consistent quality experience to the end consumer.
Quality is harder to measure than this
Quality is the combination of multiple attributes like size, color, brix, firmness, defect levels. Each of these contributes to how the product is perceived and how it behaves over time.
It is also dynamic. The condition of produce evolves continuously, which means that quality at dispatch is not necessarily indicative of quality at arrival, or on the shelf.
This makes quality inherently more difficult to measure, and even more difficult to standardize. Most retailers have specifications. But applying those specifications consistently across suppliers, regions, and inspection teams remains a challenge.
Manual inspection processes introduce variability. Interpretations differ. Data is often fragmented or delayed. As a result, quality information is less structured, less comparable, and less trusted than logistics data.
The fill rate paradox
The implications of this become visible in day-to-day operations.
Supplier performance is tracked closely, often through detailed scorecards. Fill rate targets are high, and performance is reviewed frequently. Suppliers are incentivized to meet these targets consistently.
At the same time, far less emphasis is placed on whether the product itself is aligned with downstream requirements.
Questions such as:
- Is the product at the correct ripeness stage for its intended journey?
- Will it maintain quality through the distribution and retail cycle?
- Does it meet the full set of agreed specifications, not just in theory, but in practice?
These are more difficult to answer in a standardized way, and therefore tend to receive less attention in formal performance tracking.
The result is a structural disconnect: A supplier can perform well against defined KPIs while still contributing to variability at the shelf.
From an internal perspective, performance appears strong. From a consumer perspective, the experience may be inconsistent.
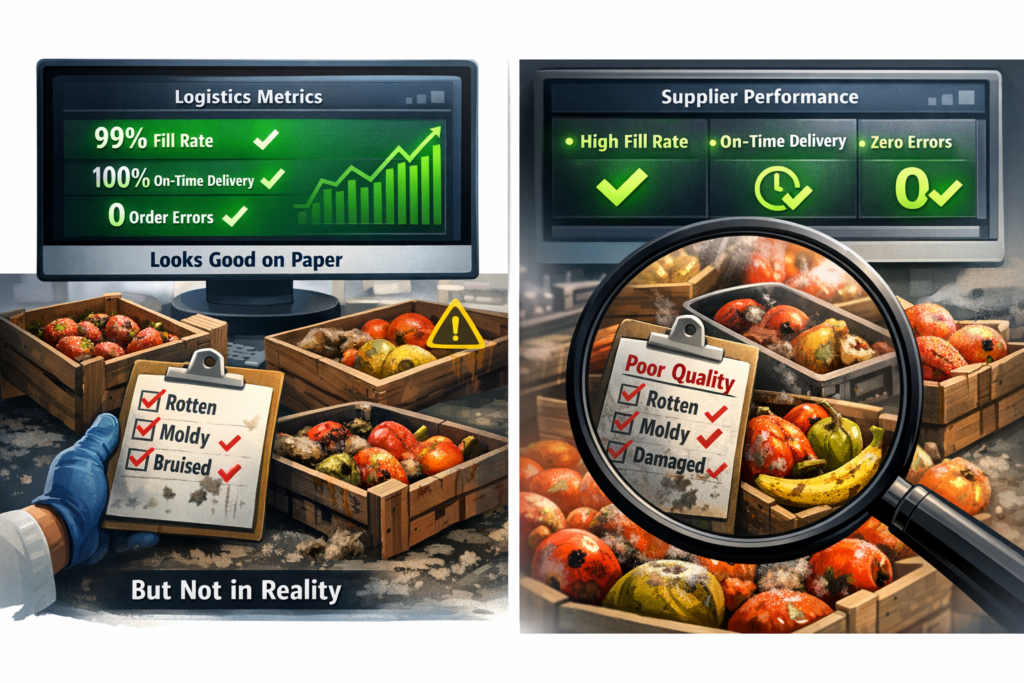
Visual idea (AI mockup): Let’s replace “rotten, moldy, bruised”. Instead, let’s have:
Color (with a check mark)
Size (with an X)
Brix (with an X)
What’s missing: quality-level visibility
When viewed through the lens of the retailer’s primary objective (consistent quality at the shelf) the gap becomes clearer.
The attributes that most directly influence that outcome are often the least systematically measured:
- Size consistency
- Color and ripeness stage
- Brix and eating quality
- Firmness and shelf life potential
- Defect rates
These factors determine how long fresh produce remains viable, how it presents visually, and how it performs when consumed. In other words, they shape the customer experience. Color, for example, is not readily captured in logistics-focused quality assurance processes. But it has a profound commercial impact.
Without structured, standardized data, these attributes are difficult to incorporate into supplier performance frameworks. They remain part of the process, but not fully integrated into decision-making.
This creates a situation in which retailers are optimizing for what is visible in their systems, rather than what their customers are experiencing.
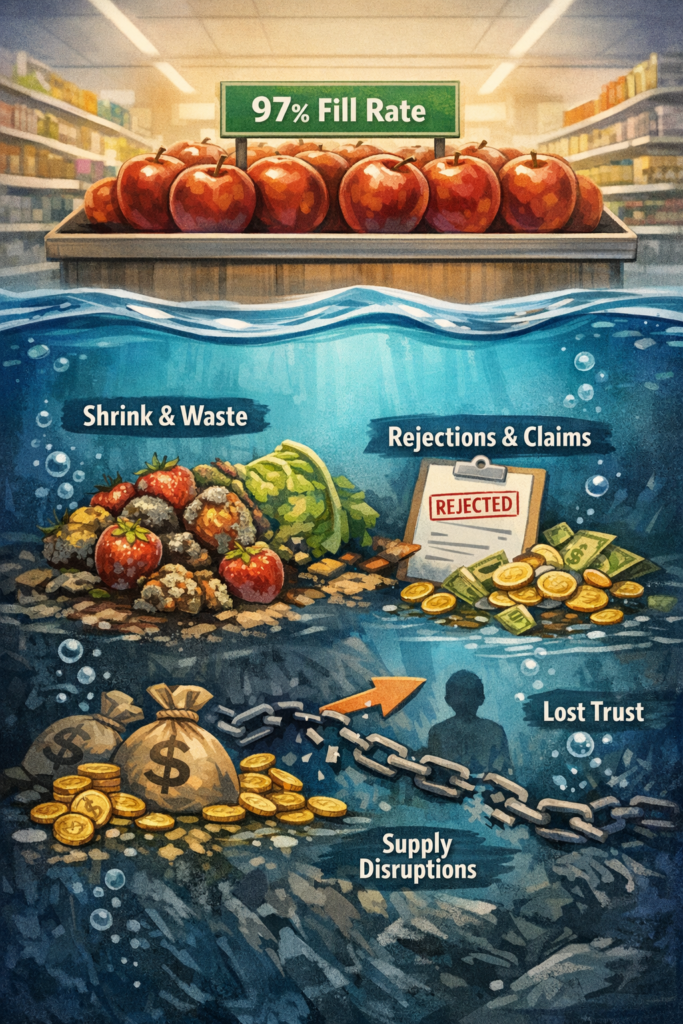
The business impact of measuring the wrong things
The consequences of this misalignment are cumulative, and tend to manifest across several areas:
Shrink and waste
Inconsistent quality leads to unpredictable shelf life. Produce that appears acceptable on arrival may deteriorate faster than expected. When that happens, produce shrink and spoilage go up, and sell-through goes down.
Rejections and claims
When expectations are not aligned, discrepancies surface at the point of delivery. This leads to disputes and costly rejections.
Customer perception and loyalty
Consumers experience fresh produce directly. Variability in quality, particularly in eating experience, has a disproportionate impact on satisfaction. Over time, this affects repeat purchasing behavior.
Supplier behavior
Suppliers respond to the metrics they are evaluated against. If performance is defined primarily in terms of fill rate and delivery, those are the areas that will be optimized, potentially at the expense of other attributes.
Together, these effects point to a broader principle: What you choose to measure, and how you do it, is a decision that actually shapes performance.
AI-powered quality controls gives retailers more options
It is important to recognize that this dynamic is not the result of oversight. It simply reflects the practical challenges of managing quality at scale.
Capturing quality data in a consistent, structured way has historically been difficult. Inspection processes are often manual, time-consuming, and subject to interpretation. There is no universally adopted framework for describing and sharing quality data across the supply chain.
In contrast, logistics data is inherently more structured and easier to standardize. Given these constraints, it is understandable that organizations prioritize what can be measured reliably.
The challenge is that this creates a gap between operational visibility and customer outcomes.
Visual idea (this is just a mockup). It should convey the idea that everything may look fine, even if it isn’t.
Leading retailers are starting to shift
Retailers are starting to expand their view of supplier performance to include quality-related attributes alongside logistics metrics.
This includes:
- Incorporating structured quality data into scorecards
- Aligning on measurable definitions of quality across trading partners
- Using data earlier in the process to reduce variability before product is shipped
These shifts reflect a growing recognition that consistency at the shelf cannot be achieved through logistics performance alone. It requires visibility into the attributes that actually drive product performance.
You get what you measure, but no more
Retailers operate in a complex environment, and metrics are an essential part of managing that complexity.
But when the metrics that are most visible are not aligned with the outcomes that matter most, the system will optimize accordingly.
In fresh produce, operational efficiency ensures that product arrives. That’s a necessary first step. But the second step, quality consistency, determines whether it sells (and whether customers return).
Discover what it looks like to measure the metrics that actually drive quality, consistency, and customer loyalty.