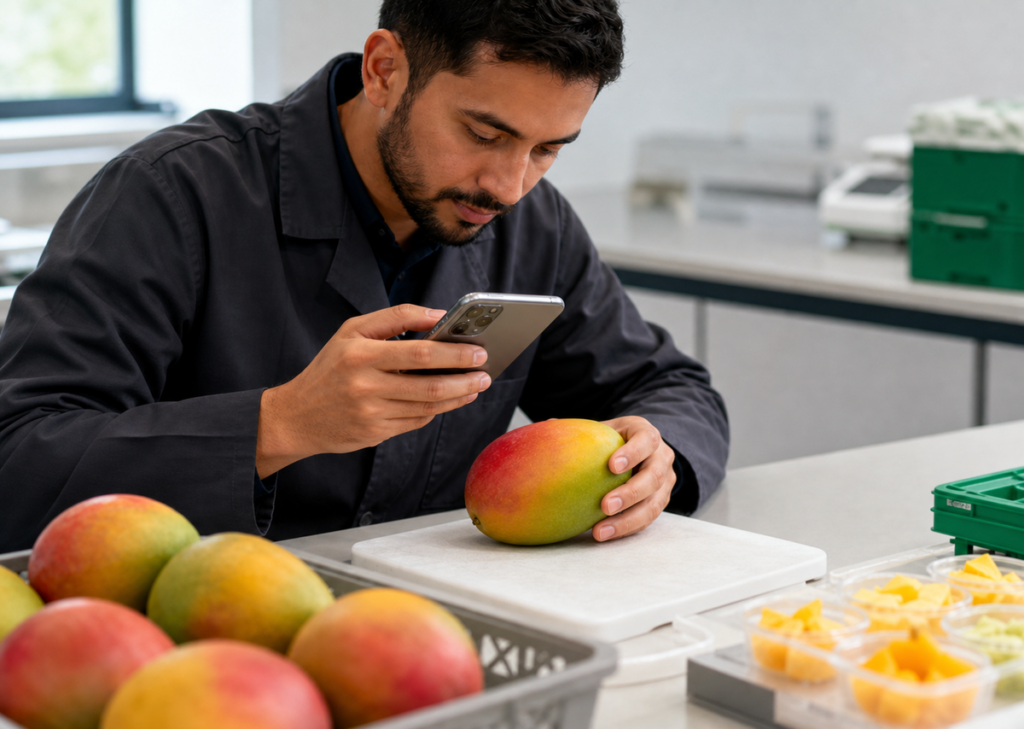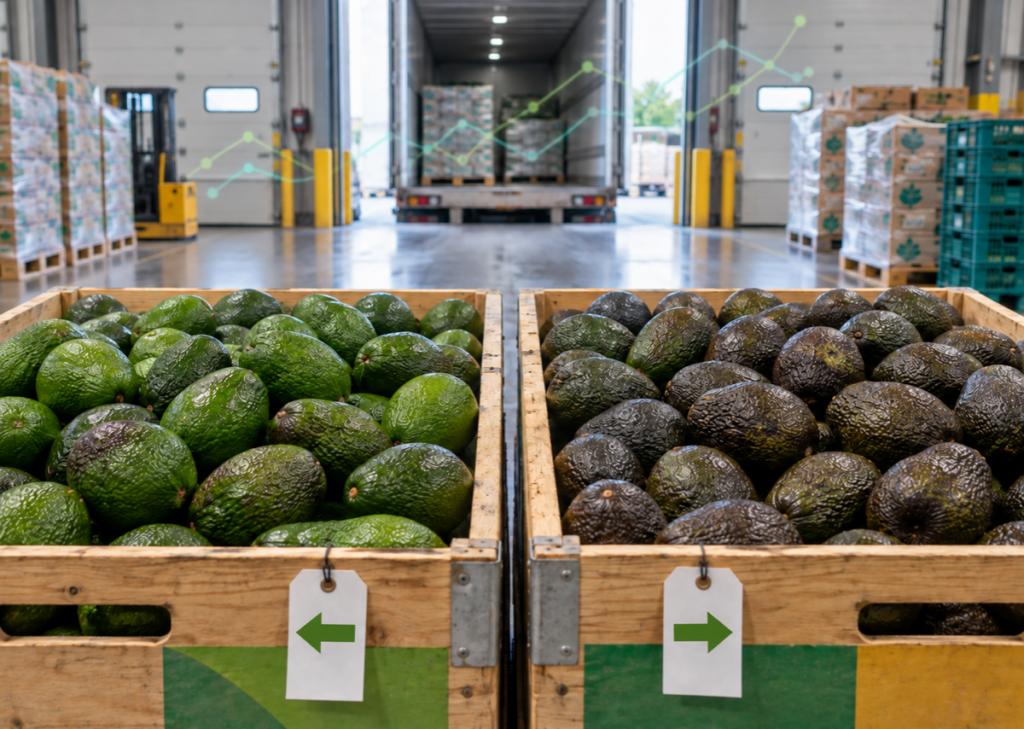
When a pallet arrives at intake, someone has to decide what happens next, primarily where it goes and how quickly it needs to move. Both those calls depend on whether its condition matches the plan that was made before it arrived.
In many operations, the basis for these decisions is still a combination of inspection results, experience and assumptions about how long a commodity should last. The problem is that two lots of the same product can arrive with very different remaining life. Harvest maturity, handling, transit conditions and defects can all extend or reduce that life.
Much of that information is already part of what an intake inspection captures. The opportunity is to turn that quality data into a more accurate forecast.
Shelf life prediction estimates the remaining saleable life of a specific batch from its measured condition and relevant supply-chain context, rather than relying only on a fixed average for the commodity.
What is shelf life prediction in fresh produce?
Shelf life prediction estimates how much saleable life remains in a specific batch based on its measured condition at a given point in the supply chain. Unlike a fixed commodity assumption, it aims to produce a batch-specific estimate using factors such as firmness, colour development, defects and, where available, cold-chain history.
Shelf life is not uniform, even within a commodity. Two pallets of the same variety can arrive in very different condition and deteriorate at different rates. A shelf life estimate is therefore a probability-based forecast, and almost never a guarantee. The value comes from improving the quality of the decision given the data.
IFPA: Supply chain of the future
Shelf-life prediction is also becoming an industry-level priority. In 2025, IFPA’s Supply Chain of the Future initiative named it as one of four foundational pillars, alongside Dynamic Incentives, Harmonized Standards and Smart Data Escrow. That framing matters: shelf-life prediction is being treated as a broader supply-chain capability to build, not simply as a feature inside one QC platform.
Why do shelf life estimates fail without intake quality data?
Shelf life estimates become unreliable when they describe the commodity as a category, rather than the actual lot. Average shelf-life tables, supplier expectations and historical rules of thumb can all be useful starting points. But they do not show how a specific batch has arrived.
After all, the condition at intake reflects everything the produce has already been through.
- Harvest maturity
- Handling damage
- Transit time and temperature exposure
These factors can leave two nominally identical lots with very different remaining saleable life.
The commercial cost of getting that estimate wrong can be significant. Fresh Del Monte COO Mohanned Abbas said in 2025 that retailers can face 4-8% shrink on the shelf. Even a modest improvement in how quickly the right product moves can yield important results.
Which quality attributes actually predict remaining shelf life?
No single intake measurement can reliably predict remaining shelf life on its own. The most useful signals depend on the commodity, variety and storage conditions, but consistently captured attributes such as firmness, colour development, defects and cold-chain history can help explain how quickly a batch is likely to deteriorate.
Quality attributes that can contribute to a shelf life estimate
| Attribute | What it can indicate | Typical capture method | Role in prediction |
| Firmness | Structural breakdown, softening and water loss | Penetrometer, durometer or other commodity-appropriate measurement | Often informative for commodities where texture changes predictably during ripening |
| Colour development | Ripening stage and progression | Standardised colour scale or image capture | Useful where colour change tracks maturity or deterioration |
| Brix/sugar content | Maturity and eating-quality development | Refractometer | More useful for maturity and eating quality than as a standalone measure of remaining days |
| Defect type and incidence | Existing damage and potential pathways for decay | Structured defect taxonomy | Important where bruising, decay or other defects shorten saleable life |
| Stem or calyx condition | Water loss, freshness and handling stress | Visual assessment against a defined scale | Commodity-specific, but useful in categories such as grapes and berries |
| Transit time and temperature history | Stress accumulated before intake | Cold-chain data linked to the batch | Adds context that helps interpret the condition measured at arrival |
Consistency and objectivity in measurement are essential. If the same attribute is recorded differently across inspectors or sites, the resulting data becomes much harder to use reliably for modelling.
What does a shelf life model need from your quality programme?
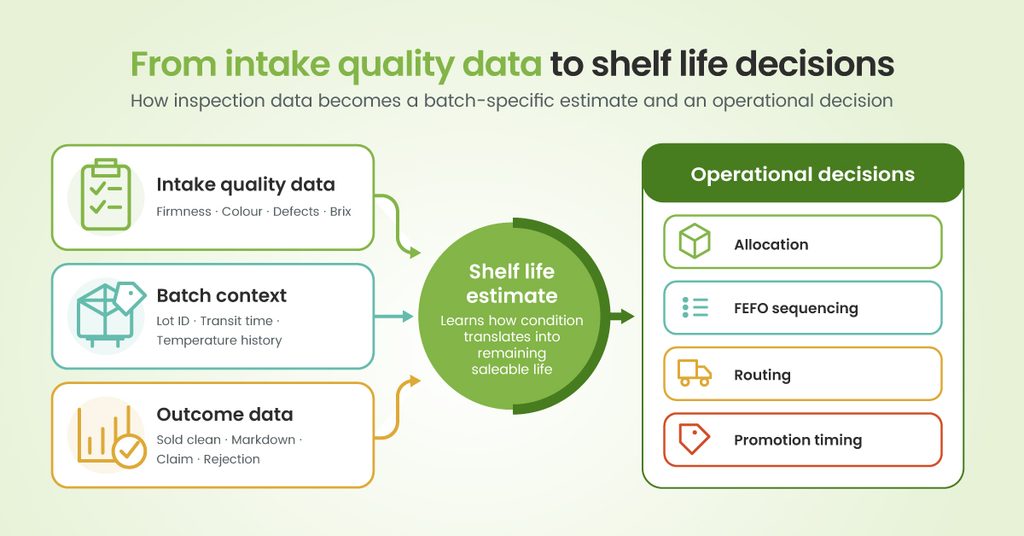
A shelf life model needs more than inspection data alone. It needs consistent digital records, enough repeated observations to identify patterns, and, critically, outcome data showing what actually happened to each batch after inspection.
Without that feedback loop, the model can see condition at intake but cannot reliably learn how that condition translated into remaining saleable life.
A strong data foundation usually includes:
- Structured digital inspection records rather than free-text notes, disconnected spreadsheets or photos stored separately.
- A shared quality vocabulary so the same defect or condition is recorded consistently across inspectors and sites.
- Sufficient inspection volume within a commodity and variety to distinguish real patterns from lot-to-lot noise.
- Persistent batch or lot identity so intake data stays attached to the same produce as it moves through the supply chain.
- Recorded outcomes such as rejection, markdown, claim, disposal or clean sale, so predictions can be calibrated against what happened next.
- Cold-chain context where available, including transit time and temperature deviations, to help explain why similar-looking lots may deteriorate differently.
For data-driven models in particular, outcome data is what turns inspection history into something that can be trained and tested rather than simply described.
How is shelf life prediction different from ripeness or grading?
This is an important distinction to make:
- Grading describes a batch’s condition now.
- Ripeness describes the stage it has reached.
- Shelf life prediction estimates how that condition is likely to change over time and how much saleable life remains.
Those are related questions, but they are not interchangeable. A batch can meet grade and ripeness requirements at intake and still have a short remaining runway because of maturity, handling stress, defects or cold-chain history.
Grading can tell a team whether produce is acceptable today; shelf life prediction is intended to help decide where it should go next and how quickly it needs to move.
How do you turn a shelf life estimate into an operational decision?
A shelf life estimate only creates value when it changes what happens to the batch. In practice, that usually means making better allocation, sequencing, pricing or routing decisions based on expected remaining life rather than arrival order alone.
Operational decisions a shelf life estimate can inform
| Decision | Without a shelf life estimate | With a shelf life estimate |
| Allocation | Batches are assigned based mainly on availability, order sequence or commercial priority | Shorter-runway batches can be directed to customers or outlets likely to sell through them faster |
| Sequencing | Stock is moved largely on a first-in, first-out basis | Teams can move toward first-expire, first-out where the data supports it |
| Pricing and promotion | Markdowns often happen once deterioration is already visible | Promotions can be brought forward for batches with a shorter expected selling window |
| Supplier conversations | Claims and disputes are handled after the problem appears | Quality patterns can be discussed against measured intake condition and downstream outcomes |
| Export and long-haul decisions | Route choice may rely mainly on commercial considerations | Longer routes can be reserved for batches with more expected remaining life |
The estimate gives quality and supply chain teams another input for decisions they already make every day, with the aim of matching each batch to the route, customer or timing it is best suited to.
What should you look for in a QC platform that supports shelf life prediction?
A QC platform should make the underlying quality data structured, consistent and portable enough to support prediction later. The important capabilities are less about whether the vendor claims to “predict shelf life” and more about whether the data foundation is strong enough to support reliable modelling.
Look for:
- Structured data capture: key attributes should be recorded in defined fields rather than buried in free text.
- Configurable specifications: inspection criteria need to stay consistent across commodities, varieties, suppliers and sites.
- Persistent batch and lot identity: quality records should remain attached to the same produce as it moves through the supply chain.
- Integration and export: inspection data should be able to connect with ERP, cold-chain and inventory systems so quality can be analysed alongside transit and temperature history.
- Clear separation between measured and modelled data: the platform should make it obvious which values come from inspections and which are generated by a model.
Shelf life prediction is probabilistic, so vendors should be able to explain what the model uses, how outputs are validated, and where uncertainty remains.
How do you start if you are not capturing this data yet?
Start by standardising the inspections already happening rather than adding more measurements straight away. The first goal is to create consistent, structured records that can be compared across inspectors, sites and batches.
A practical path is to standardise the spec, digitise inspection capture, and focus first on a high-volume commodity where teams already have repeatable inspection routines. Over time, that creates a usable history of condition, batch identity and downstream outcomes.
Prediction can be layered on once the data is strong enough to support it. The earlier stages can still create value on their own by improving consistency, making records easier to analyse, and giving teams a clearer basis for supplier conversations and operational decisions.
The inspector remains central throughout. Their judgement becomes part of the data used to improve future estimates, rather than something the model simply replaces.
Build the quality data foundation first
Shelf life prediction becomes more useful when it is built on consistent, structured quality data rather than fixed assumptions about how long a commodity should last.
Clarifresh helps fresh produce teams create that foundation by standardising inspections, connecting quality records to specific lots, and turning intake data into something that can support better downstream decisions. Clarifresh is also participating in IFPA’s Supply Chain of the Future initiative, where shelf-life prediction is one of the industry’s defined focus areas.
Book a demo to see how Clarifresh can help turn the quality data you already capture into a stronger basis for future shelf life modelling.
Frequently Asked Questions
Can quality inspection data predict shelf life on its own?
Not on its own. Inspection data describes condition at a moment; a shelf life estimate also needs recorded outcomes and, ideally, cold chain context to establish how condition translates into remaining days. Structured, consistent inspection data is the foundation, but the outcome record is what turns it into a prediction.
How much historical data is needed before predictions become useful?
There is no universal threshold, but useful patterns generally require multiple seasons of consistent inspection on a single commodity and variety, at meaningful volume. Operations usually get there faster by standardising inspections on their highest-volume line first, rather than capturing thin data across every commodity at once.
Does shelf life prediction replace inspectors?
No. Predictions are built from what inspectors record, and inspectors remain the source of judgement on edge cases and unfamiliar conditions. The practical effect is a shift in where that judgement is spent – less time on routine documentation, more on the batches where the estimate and the observation disagree.
What is the difference between shelf life prediction and ripeness detection?
Ripeness detection describes the stage a batch has reached. Shelf life prediction estimates how quickly it will move through the remaining stages and when it stops being saleable. A batch can be at an ideal ripeness stage and still have a short remaining runway, which is the case that most often causes losses at retail.
Can shelf life estimates be shared with buyers and suppliers?
They can, provided both sides agree on how the estimate was produced and what it does and does not guarantee. Shared estimates work best when they sit alongside the underlying quality data, so a buyer can see the measured condition behind the number rather than being asked to trust an output.